Build & Run
This page explains how to build, run and debug the console. We recommend to use Maven and the command line. This will work reliably across different environments and IDEs. To get a better understanding of the build process, we recommend that you take a look at the architecture as well.
All recent development happens in the branch main. There are additional branches mainly used for maintenance.
Build
If not already done, clone the code from https://github.com/hal/console/ or fork the repository into your own personal GitHub account.
For a full build use
mvn verify
This includes the GWT compiler, which might take a while. If you just want to make sure that there are no compilation or test failures, you can skip the GWT compiler and use
mvn verify -P skip-gwt
To build a HAL release ready to be used for WildFly or JBoss EAP use one of the following commands:
- WildFly:
mvn verify -P prod,theme-wildfly - JBoss EAP:
mvn verify -P prod,theme-eap
To use such a release in a WildFly distribution, follow the these steps:
- Copy
app/target/hal-console-<version>-resources.jartoWILDFLY_HOME/modules/system/layers/base/org/jboss/as/console/main/ - Edit
WILDFLY_HOME/modules/system/layers/base/org/jboss/as/console/main/module.xml - Adjust the path in
<resource-root path="..."/> - Restart WildFly, open http://localhost:9990 and verify the version number of the console.
Profiles
The POM defines the following profiles:
i18n: Builds the console with support for different languagesnative: Used to build the native binary for the standalone modeprod: Activates GWT settings for the production buildrelease: Builds and signs source and JavaDoc JARsskip-gwt: Skips GWT compilationtheme-eap: Theme for JBoss EAPtheme-hal: Theme for HAL standalone modetheme-wildfly: Theme for WildFly
Development Mode
GWT comes with a so-called development mode. In this mode a local server is started and HAL is served from http://localhost:8888. As a one time prerequisite you need to add the URL of the local server as an allowed origin to your WildFly / JBoss EAP configuration:
/core-service=management/management-interface=http-interface:list-add(name=allowed-origins,value=http://localhost:8888)
reload
resp.
/host=master/core-service=management/management-interface=http-interface:list-add(name=allowed-origins,value=http://localhost:8888)
reload --host=master
To run the console in development mode, build and install all artifacts once using mvn install from the base directory. The GWT application is located in the app folder. Use
cd app
mvn gwt:devmode
to start the development mode. Wait until you see a message like
00:00:15,703 [INFO] Code server started in 15.12 s ms
Then open http://localhost:8888/hal/dev.html in your browser and connect to your WildFly / JBoss EAP instance as described in standalone mode.
The development mode allows you to modify your Java code and see your changes simply by refreshing the browser. GWT will detect the modifications and only transpile the changed sources. All other resources like external JavaScript dependencies, stylesheets and most images are controlled and bundled by Parcel. Parcel is called as part of the Maven build using the maven-frontend-plugin.
If you want to make modifications to the resources controlled by Parcel. You can run Parcel’s watch command in another shell:
cd app
npm run watch
This will detect changes to the resources controlled by Parcel and automatically reload your browser when these resources have been modified.
Debug
Start the console as described in the previous chapter. GWT uses the SourceMaps standard to map the Java source code to the transpiled JavaScript code. This makes it possible to use the browser development tools for debugging.
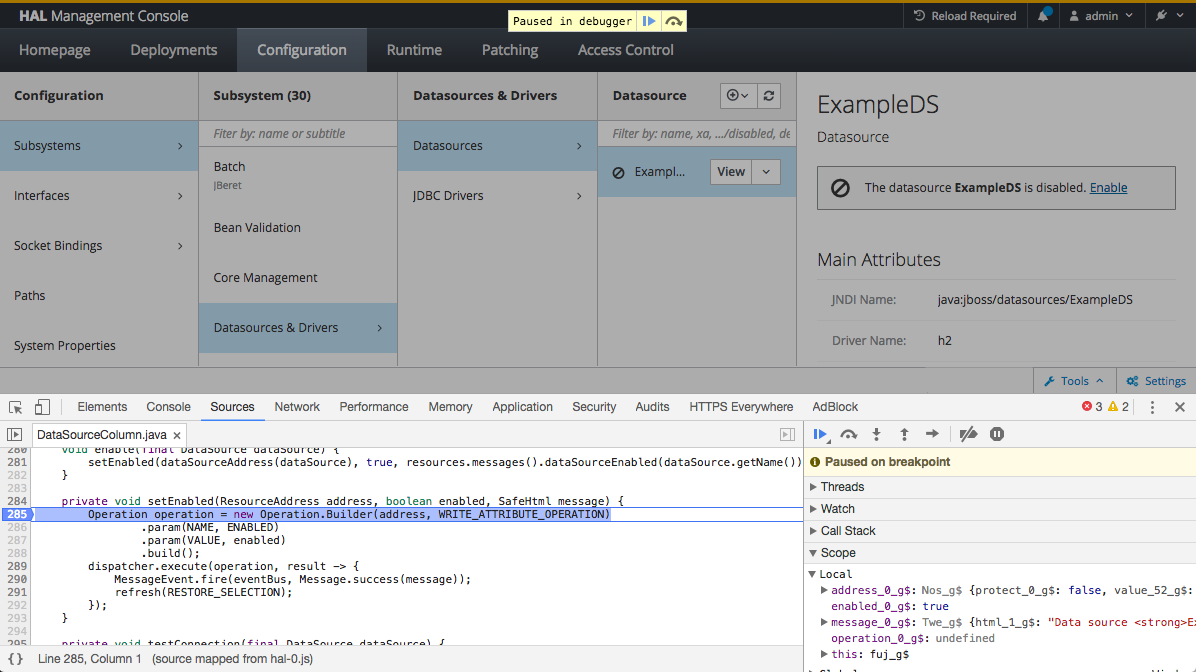
In Chrome open the development tools and switch to the ‘Sources’ tab. Press ⌘ P and type the name of the Java source file you want to open.
Let’s say we want to debug the enable / disable action in the data source column in configuration. Open the class DataSourceColumn and put a breakpoint on the first line of method void setEnabled(ResourceAddress, boolean, SafeHtml) (should be line 285). Now select a data source like the default ‘ExampleDS’ data source and press the enable / disable link in the preview. The browser should stop at the specified line and you can use the development tools to inspect and change variables.
Inspect Variables
If you’re used to debug Java applications in your favorite IDE, the debugging experience in the browser development tools might feel strange at first. You can inspect simple types like boolean, numbers and strings. Support for native JavaScript types like arrays and objects is also very good. On the other hand Java types like lists or maps are not very well supported. In addition most variable names are suffixed with something like _0_g$. We recommend to inspect these variables using the console and call the toString() method on the respective object.
Scripts
This repository contains some scripts to automate various development tasks.
depgraph.sh
Generates a visual dependency graph.
format.sh
Formats the codebase by applying the following maven goals:
validate.sh
Validates the codebase by applying the following maven goals:
enforcer:enforcecheckstyle:checklicense-maven-plugin:checkformatter-maven-plugin:validateimpsort-maven-plugin:check
release.sh
Releases a new HAL version.
versionBump.sh
Bumps the version to the specified version number.
